Introduction
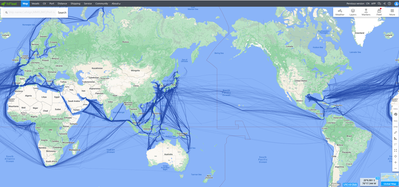
70% of the earth's surface is covered by the ocean, and the originally limited resources of the earth are naturally isolated due to such natural conditions. However, since the end of the 15th century, the advent of merchant shipping has made the limited resources of the earth better distributed. After entering the modern society, more than 80% of international trade in the world is completed by sea, and China, as a large importer of resources and energy, 90% of its import volume is completed by sea.
HiFleet shipping data is the data sorting and analysis of the shipping, arrival, in-transit and expected arrival information of the world's bulk commodities, so that users can grasp the shipping logistics information of the commodities they care about at any time. The main types of shipping data involved are iron ore, coal, bauxite, grain, crude oil, LPG and LNG.
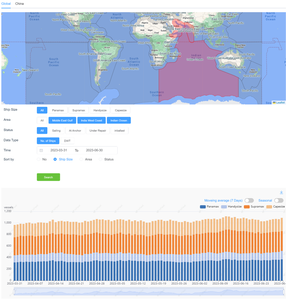
Global capacity distribution analysis
The analysis and statistics of shipping transportation capacity and its global distribution, by ship type, location, status and time period will be filtered accordingly.
If you'd like to try this service, you need to register and log in our platform first. Please click here. Any problem, please feel free to contact us by support@hifleet.com.
Methodology
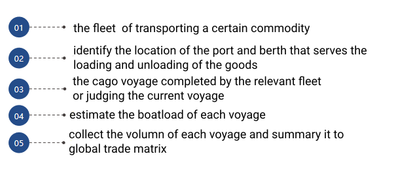
It determined the fleet that had the ability to load a certain cargo, tracked the ships through AIS data, integrated the business ports and terminals, and analyzed the typical ship behavior with the help of big data and AI technology. On this basis, the vessel information of a single voyage is obtained.
Filter from a large data matrix based on multiple criteria, such as type of goods, data type (export, import, in-transit, and expected arrival), exporting country, and importing country The selected data can be sorted and combined in different ways to meet the data needs of various statistical periods (daily, weekly, monthly, and annual) and statistical diameters (country, port, and mine).
Effective
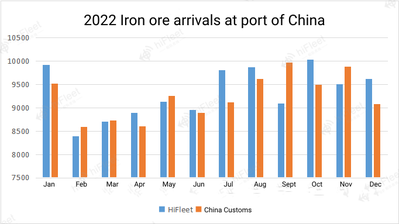
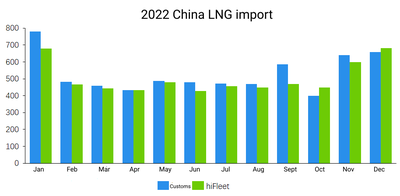
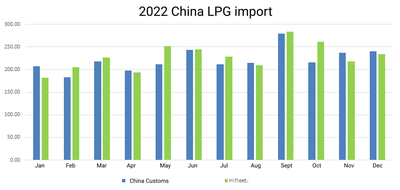
We compare the monthly maritime import statistics of HiFleet in 2022 with the monthly import statistics of China Customs, and analyse the reasons for the error, mainly due to the difference in the selection of statistical time reference points and the statistical method of cargo volume between HiFleet and China Customs. At the same time, the customs statistics include the imported goods at land customs. Compared with the statistical data of China Customs, there are errors within a reasonable range and deviations in the time period, but the statistical time of HiFleet is leading and the statistical period has high frequency and diversity.
Go to the bulk trade data analysis page clike here
APP download
Go to our web: www.hifleet.com
Contact us: support@hifleet.com


