

Topic starter
28/07/2026 7:44 am
During long-term operation, a vessel's hull surface is susceptible to fouling and coating deterioration. Even though these changes do not trigger a direct equipment alarm, they may gradually appear as declining speed, increasing speed loss, higher energy consumption at the same speed, and lower operational efficiency.
How much vessel performance can be restored after dry-docking?
Traditionally, performance assessment relied more heavily on people’s experience. Nowadays, HiFleet's long-term vessel daily report data allow speed, fuel consumption, and speed loss rate before and after dry-docking to be compared under consistent operating conditions, making dry-docking results data-based, analyzable, and verifiable.
11.1%
Highest Speed Increase
3.1%
Highest Reduction in Daily ME Fuel Consumption
8.06 percentage points
Greatest Improvement in Speed Loss Rate
(Data basis: vessel daily reports under good-weather, laden, and steady-sailing conditions, with fuel consumption normalized and current effects corrected.)
- Clean the Data First for Reliable Results
Vessel performance is affected by weather, loading condition, draft, current speed and direction, and the stage of the voyage.
For example, vessel speed is usually lower shortly after departure, before berthing, or during low-speed harbor operations. Adverse weather and different loading conditions can also directly affect resistance and fuel consumption.
If all these data are mixed, normal differences in operating conditions can easily be mistaken for changes in vessel performance.
This analysis is based on HiFleet POSITION REPORT data from vessel daily reports, with a consistent set of screening and correction procedures:
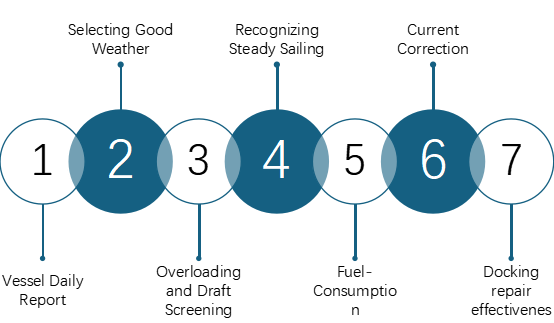
✅ Screen for good-weather conditions
Only data with wind force no greater than Beaufort 4 and wave height no greater than 1.25 m were retained, reducing the effects of wind and waves on speed and fuel consumption.
✅ Standardize loading conditions
Laden-condition data were selected, while records with excessive draft differences that could not be compared directly were excluded.
✅ Identify steady-sailing periods
Harbor low-speed operations, periods shortly after departure or before berthing, and other abnormal operating conditions were excluded. Only relatively stable sailing periods were analyzed.
✅ Standardize the fuel-consumption basis
Main-engine fuel consumption was normalized to a 24-hour basis according to actual sailing time.
✅ Correct for current effects
Current speed and direction were considered to reduce the influence of favorable or adverse currents on actual vessel speed.
The analysis therefore applies a consistent basis covering good weather, steady sailing, laden conditions, 24-hour fuel-consumption normalization, and current correction.
- Three Core Metrics for a Comprehensive Performance Assessment
This analysis focuses on the following three metrics:
- Average speed: The vessel's actual speed under comparable weather, loading, and sailing conditions.
- ME fuel consumption: Main-engine fuel consumption normalized to a 24-hour basis, avoiding distortions caused by different actual sailing durations.
- Speed loss rate: The deviation of actual speed from theoretical speed.
Under the methodology used in this analysis, a speed loss rate closer to 0 indicates that actual speed is closer to theoretical speed and that vessel performance is better. Looking at only one metric can be misleading. For example, unchanged fuel consumption does not necessarily mean that performance has not improved. If a vessel can achieve a higher speed at the same fuel consumption, this also indicates better propulsion efficiency and operational performance.
- Case Vessel A: Faster, Yet More Fuel-Efficient
Vessel A: Bulk Carrier, DWT 56,920 MT, Design Draft 12.8 m, Service Speed 14.2 knots.
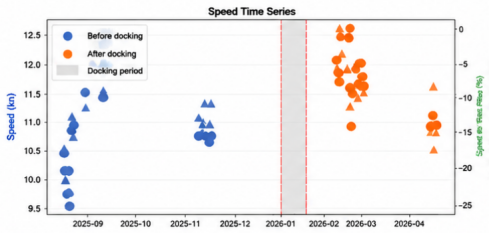
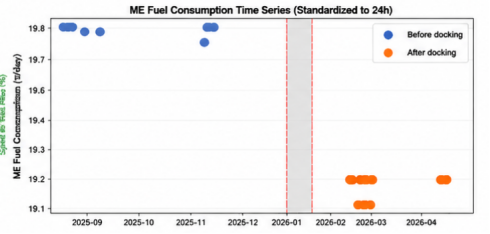
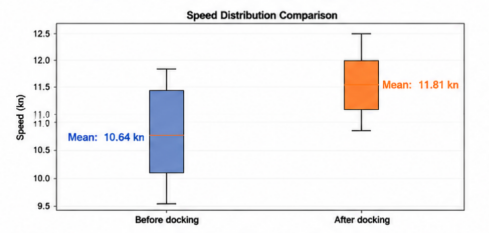
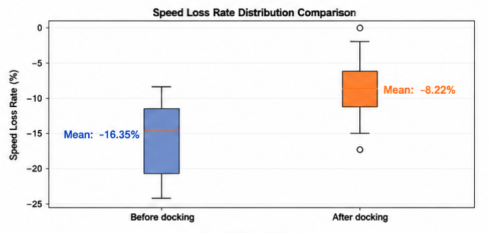
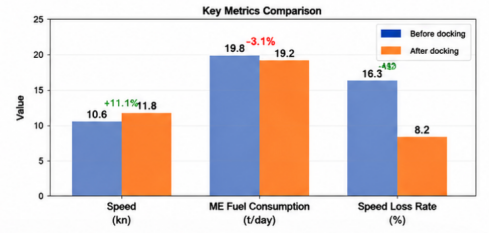
After operating-condition screening, the core performance changes for Case Vessel A before and after dry-docking were as follows:
|
Metric |
Before |
After |
Change |
|
Avg. Speed |
10.64 kn |
11.81 kn |
Up 11.1% |
|
ME Fuel Cons. |
19.79 t/day |
19.17 t/day |
Down 3.1% |
|
Speed Loss Rate |
-16.12% |
-8.06% |
Improved by 8.06 percentage points |
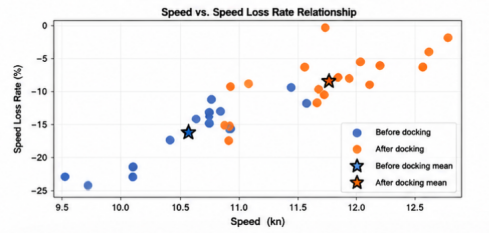
After dry-docking, Case Vessel A's average speed increased significantly, while its 24-hour main-engine fuel consumption decreased and its speed loss rate moved substantially closer to 0.
Under the screened and comparable operating conditions, Case Vessel A not only sailed faster but also consumed less fuel, with clear improvements across all three metrics.
Key Findings:
✅ Speed increased by more than 10%;
✅ Daily ME fuel consumption decreased rather than increased;
✅ The gap between actual and theoretical speed narrowed significantly.
- Case Vessel B: Same Fuel Consumption, Better Sailing Performance
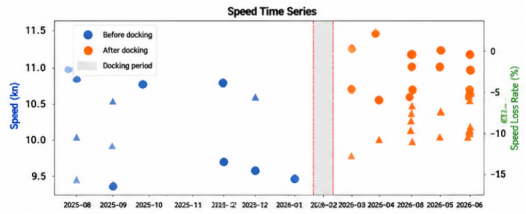
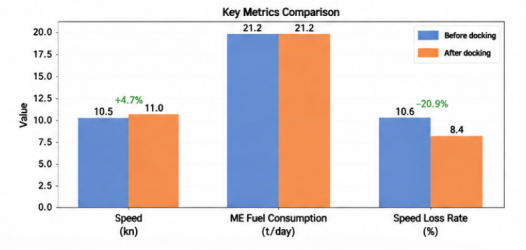
The performance changes for Case Vessel B before and after dry-docking were as follows:
|
Metric |
Before |
After |
Change |
|
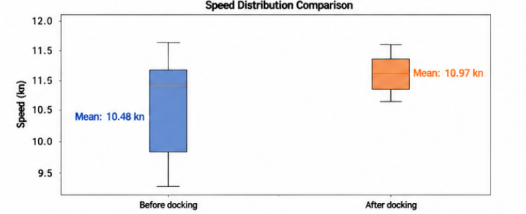
Avg. Speed |
10.48 kn |
10.97 kn |
Up 4.7% |
|
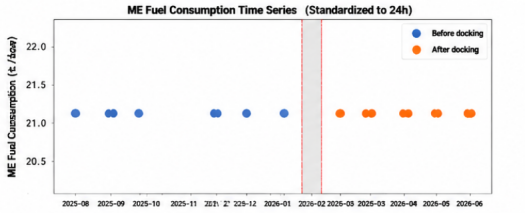
ME Fuel Cons. |
21.20 t/day |
21.20 t/day |
Essentially unchanged |
|
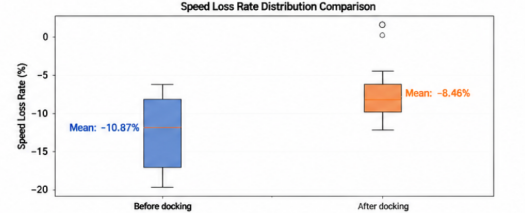
Speed Loss Rate |
-10.62% |
-8.40% |
Improved by 2.22 percentage points |
Unlike Case Vessel A, Case Vessel B did not show a significant reduction in daily main-engine fuel consumption.
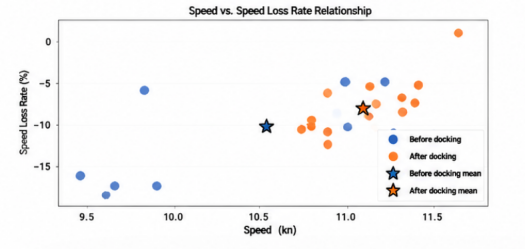
However, with fuel consumption remaining essentially unchanged, its average speed increased by 4.7% and its speed loss rate also improved.
In other words, Case Vessel B achieved:
Better sailing performance at the same energy consumption.
This also shows that dry-docking results should not be assessed solely by whether fuel consumption decreases. Speed, fuel consumption, and speed loss rate should be evaluated together.
Key Findings:
✅ Daily ME fuel consumption remained essentially unchanged;
✅ Average speed increased significantly;
✅ Sailing performance per unit of energy improved.
- Dry-Docking Results: No Longer Based on Experience Alone
Both case vessels showed performance improvements of different magnitudes after dry-docking:
|
Case |
Speed |
ME Fuel |
Speed Loss |
|
Case Vessel A |
+11.1% |
-3.1% |
+8.06 percentage points |
|
Case Vessel B |
+4.7% |
Essentially unchanged |
+2.22 percentage points |
Case Vessel A showed higher speed and lower fuel consumption, while Case Vessel B achieved higher speed at the same fuel consumption.
Although the forms of improvement differed, both results demonstrate that:
✅ Dry-docking results can be quantified
A before-and-after comparison under consistent operating conditions clearly shows whether performance improved and by how much.
✅ No single metric should be viewed in isolation
Speed, fuel consumption, and speed loss rate must be evaluated together to identify vessel performance changes accurately.
✅ Data can support maintenance decisions
Differences in the magnitude of improvement can be further analyzed together with the pre-drydocking performance baseline, hull fouling condition, coating condition, scope of work, and operating environment.
The original report rated the overall results for the two case vessels as "Excellent" and "Good," respectively. Both vessels showed improvements in speed and speed loss rate after dry-docking.
- From One-Off Dry-Docking Assessment to Continuous Performance Management
The real value lies not only in concluding that a dry-docking was effective, but in establishing a sustainable vessel performance management loop.
Before Dry-Docking | Establish a Performance Baseline
Establish baseline values for speed, fuel consumption, and speed loss rate under consistent weather, loading, and sailing conditions.
After Dry-Docking | Continue Tracking Performance
As post-drydocking data accumulate, monitor whether the performance improvement is sustained.
During Operation | Identify Performance Deterioration
When speed declines continuously, speed loss increases, or fuel consumption rises abnormally under comparable conditions, investigate the issue together with hull, main-engine, and operational records.
At Fleet Level | Conduct Cross-Vessel Comparisons
Compare different vessels, dry-docking batches, and coating solutions over the long term to support fleet maintenance planning.
HiFleet Vessel Performance Analytics
Based on vessel daily reports and long-term sailing data, HiFleet helps shipping companies achieve:
✅ Quantifiable performance: Integrated analysis of speed, fuel consumption, and speed loss rate
✅ More reliable data: Automatic screening for weather, loading, and steady-sailing conditions
✅ Verifiable results: Clear presentation of performance changes before and after dry-docking
✅ Continuous tracking: Extending one-off assessments into long-term trend management
✅ Data-driven decisions: Supporting dry-docking, hull cleaning, and hull-maintenance decisions
Dry-docking completion does not mark the end of performance assessment.
Let data continuously record vessel condition, reveal every performance change earlier, and provide evidence for the value of every maintenance investment.
Let HiFleet be your vessel performance management assistant.
Starting with vessel daily reports, make dry-docking results visible, analyzable, and verifiable.
Note
The data in this article are sourced from anonymized vessel daily reports. The conclusions reflect performance during a specific statistical period and under comparable operating conditions; they are not equivalent to standard sea trials or contractual performance guarantee testing.
Dry-docking generally includes hull cleaning, coating maintenance, and other repair work. The performance changes presented here represent the combined effects after dry-docking and are not attributed solely to hull-fouling removal.